

Model Portfolios - Interactive View
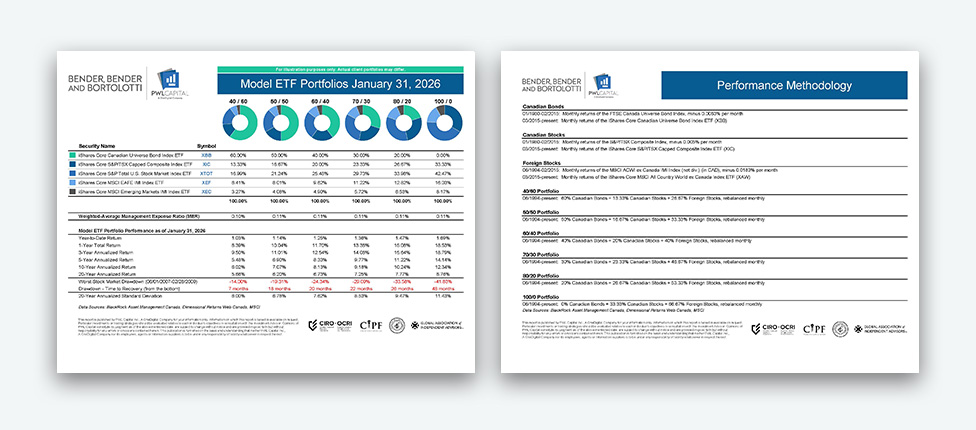
For illustration purposes only. Actual client portfolios may be different.
| Year-to-Date Return | 1.03% |
| 1-Year Total Return | 8.39% |
| 3-Year Annualized Return | 9.50% |
| 5-Year Annualized Return | 5.48% |
| 10-Year Annualized Return | 6.02% |
| 20-Year Annualized Return | 5.66% |
| Worst Stock Market Drawdown (06/01/2007-02/28/2009) | -14.00% |
| Drawdown - Time to Recovery (from the bottom) | 7 months |
| 20-Year Annualized Standard Deviation | 6.00% |
40/60
Funds Holdings
|
iShares Core Canadian Universe Bond Index ETF
|
60.00% |
|
iShares Core S&P/TSX Capped Composite Index ETF
|
13.33% |
|
Vanguard U.S. Total Market Index ETF
|
16.99% |
|
iShares Core MSCI EAFE IMI Index ETF
|
6.41% |
|
iShares Core MSCI Emerging Markets IMI Index ETF
|
3.27% |
| Year-to-Date Return | 1.14% |
| 1-Year Total Return | 10.04% |
| 3-Year Annualized Return | 11.01% |
| 5-Year Annualized Return | 6.90% |
| 10-Year Annualized Return | 7.07% |
| 20-Year Annualized Return | 6.20% |
| Worst Stock Market Drawdown (06/01/2007-02/28/2009) | -19.31% |
| Drawdown - Time to Recovery (from the bottom) | 18 months |
| 20-Year Annualized Standard Deviation | 6.78% |
50/50
Funds Holdings
|
iShares Core Canadian Universe Bond Index ETF
|
50.00% |
|
iShares Core S&P/TSX Capped Composite Index ETF
|
16.67% |
|
Vanguard U.S. Total Market Index ETF
|
21.24% |
|
iShares Core MSCI EAFE IMI Index ETF
|
8.01% |
|
iShares Core MSCI Emerging Markets IMI Index ETF
|
4.08% |
| Year-to-Date Return | 1.25% |
| 1-Year Total Return | 11.70% |
| 3-Year Annualized Return | 12.54% |
| 5-Year Annualized Return | 8.33% |
| 10-Year Annualized Return | 8.13% |
| 20-Year Annualized Return | 6.73% |
| Worst Stock Market Drawdown (06/01/2007-02/28/2009) | -24.34% |
| Drawdown - Time to Recovery (from the bottom) | 20 months |
| 20-Year Annualized Standard Deviation | 7.62% |
60/40
Funds Holdings
|
iShares Core Canadian Universe Bond Index ETF
|
40.00% |
|
iShares Core S&P/TSX Capped Composite Index ETF
|
20.00% |
|
Vanguard U.S. Total Market Index ETF
|
25.48% |
|
iShares Core MSCI EAFE IMI Index ETF
|
9.62% |
|
iShares Core MSCI Emerging Markets IMI Index ETF
|
4.90% |
| Model Portfolio Performance | 70/30 |
|---|---|
| Year-to-Date Return | 1.36% |
| 1-Year Total Return | 13.38% |
| 3-Year Annualized Return | 14.08% |
| 5-Year Annualized Return | 9.77% |
| 10-Year Annualized Return | 9.18% |
| 20-Year Annualized Return | 7.25% |
| Worst Stock Market Drawdown (06/01/2007-02/28/2009) | -29.09% |
| Drawdown - Time to Recovery (from the bottom) | 22 months |
| 20-Year Annualized Standard Deviation | 8.53% |
70/30
Funds Holdings
|
iShares Core Canadian Universe Bond Index ETF
|
30.00% |
|
iShares Core S&P/TSX Capped Composite Index ETF
|
23.33% |
|
Vanguard U.S. Total Market Index ETF
|
29.73% |
|
iShares Core MSCI EAFE IMI Index ETF
|
11.22% |
|
iShares Core MSCI Emerging Markets IMI Index ETF
|
5.72% |
| Model Portfolio Performance | 80/20 |
|---|---|
| Year-to-Date Return | 1.47% |
| 1-Year Total Return | 15.08% |
| 3-Year Annualized Return | 15.64% |
| 5-Year Annualized Return | 11.22% |
| 10-Year Annualized Return | 10.24% |
| 20-Year Annualized Return | 7.77% |
| Worst Stock Market Drawdown (06/01/2007-02/28/2009) | -33.58% |
| Drawdown - Time to Recovery (from the bottom) | 26 months |
| 20-Year Annualized Standard Deviation | 9.47% |
80/20
Funds Holdings
|
iShares Core Canadian Universe Bond Index ETF
|
20.00% |
|
iShares Core S&P/TSX Capped Composite Index ETF
|
26.67% |
|
Vanguard U.S. Total Market Index ETF
|
33.98% |
|
iShares Core MSCI EAFE IMI Index ETF
|
12.82% |
|
iShares Core MSCI Emerging Markets IMI Index ETF
|
6.53% |
| Model Portfolio Performance | 100/0 |
|---|---|
| Year-to-Date Return | 1.69% |
| 1-Year Total Return | 18.53% |
| 3-Year Annualized Return | 18.79% |
| 5-Year Annualized Return | 14.14% |
| 10-Year Annualized Return | 12.34% |
| 20-Year Annualized Return | 8.76% |
| Worst Stock Market Drawdown (06/01/2007-02/28/2009) | -41.83% |
| Drawdown - Time to Recovery (from the bottom) | 48 months |
| 20-Year Annualized Standard Deviation | 11.43% |
100/0
Funds Holdings
|
iShares Core Canadian Universe Bond Index ETF
|
0.00% |
|
iShares Core S&P/TSX Capped Composite Index ETF
|
33.33% |
|
Vanguard U.S. Total Market Index ETF
|
42.47% |
|
iShares Core MSCI EAFE IMI Index ETF
|
16.03% |
|
iShares Core MSCI Emerging Markets IMI Index ETF
|
8.17% |