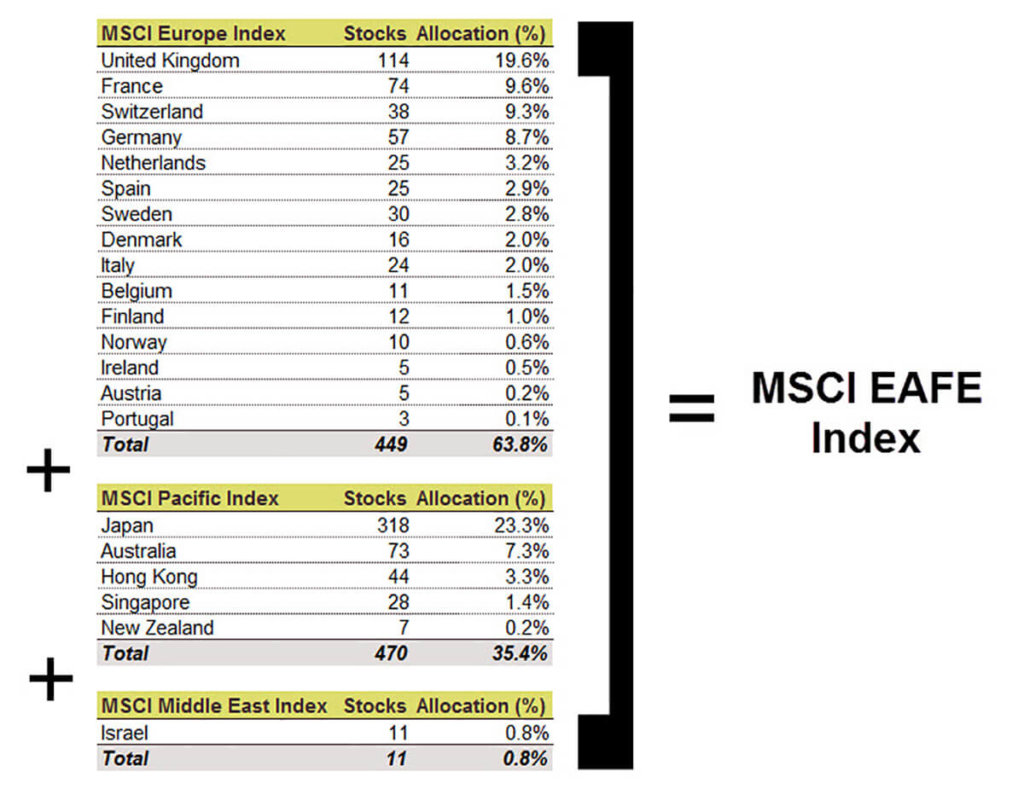
The MSCI EAFE Index is arguably the most popular international index on the block. Many active fund managers’ returns are benchmarked to this index (and the majority of them fail to outperform it). Couch potato investors also tend to allocate a portion of their portfolios to ETFs that track the MSCI EAFE or a similar index.
If we pop the hood on the MSCI EAFE Index, we can see that it currently allocates 63.8% to European companies, 35.4% to Pacific companies and 0.8% to Middle Eastern companies. These weights are free to fluctuate over time, based on the performance of the underlying currencies and stocks.

A reader recently asked me whether they should attempt to outperform the MSCI EAFE Index by allocating 50 percent to a Europe ETF and 50 percent to a Pacific ETF. Although this may sound like active management, many notable index investors, like Rick Ferri and Ben Carlson, have advocated this approach in the past. Most of their analysis indicates that a 50-50 split between European and Pacific stocks has historically outperformed the MSCI EAFE Index.
Whenever I read arguments in favour of tinkering with a plain-vanilla index approach, I like to run the numbers myself, both from a Canadian investor perspective and an overall portfolio perspective. To do this, I’ve created two balanced portfolios for comparison; one has a 20% allocation to the MSCI EAFE Index, while the other allocates 10% to the MSCI Europe Index and 10% to the MSCI Pacific Index. The portfolios are then rebalanced annually at the end of each year.
| INDEX | PORTFOLIO 1 (100% MSCI EAFE INDEX) | PORTFOLIO 2 (50% MSCI EUROPE INDEX + 50% MSCI PACIFIC INDEX) |
|---|---|---|
| FTSE TMX Canada Universe Bond Index | 40% | 40% |
| S&P/TSX Composite Index | 20% | 20% |
| S&P 500 Index | 20% | 20% |
| MSCI EAFE Index | 20% | |
| MSCI Europe Index | 10% | |
| MSCI Pacific Index | 10% | |
| Total | 100% | 100% |
The results will likely surprise many readers. The returns were not only close, but identical for the 10 and 20 year periods. The 50-50 split portfolio outperformed the 100 percent EAFE portfolio since inception with a lower standard deviation, but the differences were immaterial. Also, the analysis did not factor in the additional capital gains taxes that would have likely been realized by taxable investors while rebalancing the Europe and Pacific component back to its 50-50 target. Based on the results below, I see no compelling evidence that suggests splitting the EAFE allocation has resulted in anything more than additional taxes and portfolio complexity.
Performance Results as of June 30, 2016
| ANNUALIZED RETURN | PORTFOLIO 1 (100% MSCI EAFE INDEX) | PORTFOLIO 2 (50% MSCI EUROPE INDEX + 50% MSCI PACIFIC INDEX) |
|---|---|---|
| 1 Year | 2.77% | 2.86% |
| 3 Year | 10.27% | 10.25% |
| 5 Year | 8.75% | 8.80% |
| 10 Year | 6.33% | 6.33% |
| 20 Year | 7.00% | 7.00% |
| Since Inception (01/1980 to 06/2016) | 10.12% | 10.16% |
| Std Dev Since Inception | 8.48% | 8.44% |