No matter how much evidence piles up in favour of passive investing, the active vs. passive debate just won’t die. Like the undead zombies from your favourite horror flick, the debate springs back to life, hungry for more brains to consume.
But fear not – in this video, I’m determined to put this debate to rest for good.
In our last video, we presented the academic theory behind active vs. passive investing. On average, active investors must own each stock in the same proportion as the total stock market. So, it stands to reason: As a group, active investors must earn the return of the stock market, minus costs. The conclusion is a no-brainer: After costs, the group must underperform the market. The same can be said for passive investors as a group, but since their costs are lower, passive investing prevails in the end.
The logic is damning. Then again, theory isn’t reality. If the higher costs of active management do in fact lead to underperformance, we should see this in active investors’ track record as a group. Today, we’ll examine the evidence to see if active management has actually been performing as poorly as theory would suggest.
Practically speaking, it’s impossible to quantify exactly how many active investors are winning or losing against the market. You’d need the performance data for every actively managed mutual fund, hedge fund manager, pension fund, endowment fund, day trader, retail investor, and so on. Instead, most analyses focus on the actively managed mutual fund industry as a proxy. The data is easy enough to access, and it’s a large enough sample to generate statistically significant results.
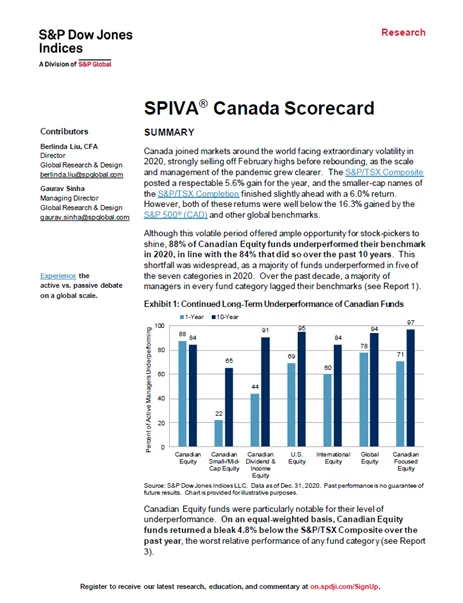
By far, the Standard & Poor’s Indices Versus Active Scorecard—or SPIVA® to its friends—is the best-known, ongoing report for tracking active vs. passive investment results. The S&P Dow Jones Indices produces its SPIVA® Scorecard semiannually, comparing actively managed funds’ after-cost performances against their most appropriate S&P Dow Jones passive indices.
The SPIVA® Scorecard also accounts for something called survivorship bias. Often, underperforming funds are liquidated or merged with other funds over time to make the fund company’s worst performers magically disappear. This can create a bias in favour of the active funds, as any remaining winners now make up a higher percentage of a smaller base of surviving funds. And it’s not just a few funds that don’t make the cut. As of December 31, 2020, 54% of all funds in their eligible universe 10 years prior had since been liquidated or merged. That’s more than half of them!
As an example, 70 Canadian equity funds existed on December 31, 2010. A decade later, by year-end 2020, only 38 funds remained. Of those 38 funds, 11 of them were winners, outperforming their index, while 27 of them were losers. In percentage terms, 71.05% of the surviving actively managed funds underperformed the index.
But this figure doesn’t penalize the 32 actively managed funds that were merged or liquidated out of existence during this period, most likely due to their poor performance. Mutual fund companies don’t generally scrap winning funds from their product line-up.
If we combine these 32 funds that didn’t survive with the 27 funds that did survive, but underperformed the index, we now have 59 underperforming funds out of a total of 70, or 84.29%. This figure is noticeably higher than the uncorrected 71.05% figure, which didn’t adjust for survivorship bias.

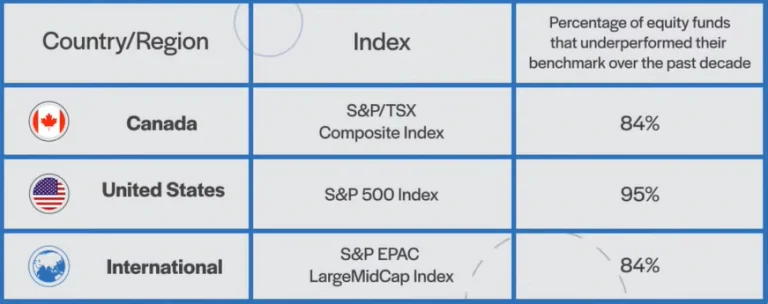
Now back to the results of the SPIVA Canada Scorecard. Over the past 10 years ending December 31, 2020, 84% of actively managed Canadian equity and international equity funds failed to outperform the S&P/TSX Composite Index and the S&P Europe, Pacific, and Asia (EPAC) LargeMidCap Index, respectively. Even worse, 95% of actively managed U.S. equity funds couldn’t beat the mighty S&P 500 Index.
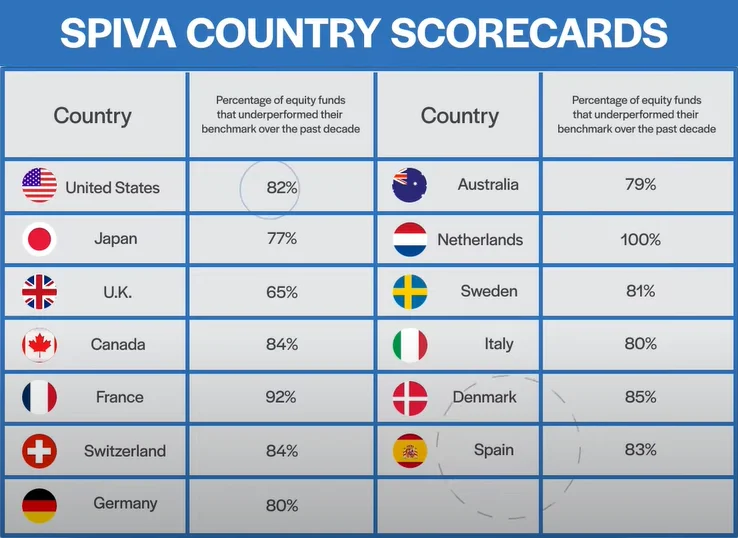
But what if Canadian fund managers are just less skilled than active managers in other countries? Fortunately for us, the SPIVA methodology has also been applied around the world, and the results are relatively consistent across the board. The message is clear: Most actively managed funds don’t beat the returns of their passive benchmark index.
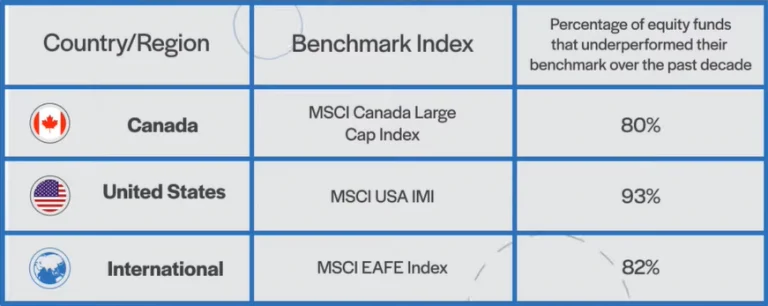
Vanguard periodically releases a report called “The case for low-cost index-fund investing”. Like the SPIVA® Canada Scorecard, the report showcases the high likelihood of active managers underperforming a comparable index after fees. Vanguard also accounts for survivorship bias in their results, so funds that are shut down or merged with other funds are still included in the results.
According to Vanguard’s report, how did active managers fare over the past decade?
Well, as of December 31, 2020, 80% of Canadian large-cap equity funds underperformed Vanguard’s chosen benchmark, the MSCI Canada Large Cap Index. U.S. equity funds were even worse, with 93% of them underperforming the MSCI USA Investable Market Index over the same period. And on the international front, 82% of equity funds failed to beat the returns of the MSCI EAFE Index.
So far, we’ve pointed to reports that pair actively managed fund performance to comparable indexes. Perhaps that’s not entirely fair. Passive investors also incur fund costs, so it might make more sense to compare the net performance of actively managed funds to their passively managed counterparts. After fees, which approach has come out ahead?
This is exactly what Morningstar has been doing with its semi-annual Active/Passive Barometer report. For example, instead of using the S&P 500 or a similar index as the benchmark for large-cap U.S. equity funds, they have created a composite of index funds and ETFs with similar strategies, like the Vanguard Total Stock Market Index Fund (VTSAX), the SPDR S&P 500 ETF Trust (SPY), and so on. They then calculate an equal-weighted average return for this passive group, which becomes the hurdle rate for an active manager to beat.
Morningstar’s methodology also ensures they’re not cherry-picking a single index, which could skew the results in favour of passive investing. For example, the number of market-beating U.S. equity funds can vary in any given year depending on whether you compare their performance to the CRSP US Total Market Index or the S&P 500 Index. The playing field is more even if you compare them to a composite of both.
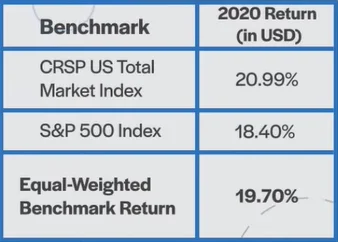
Morningstar’s report is also extensive. Its 2020 analysis included nearly 4,400 funds representing approximately $15.9 trillion USD in assets. That’s roughly two-thirds of the U.S. mutual fund market. And like the other reports, Morningstar corrects for survivorship bias by including all funds that existed at the beginning of each measurement period.
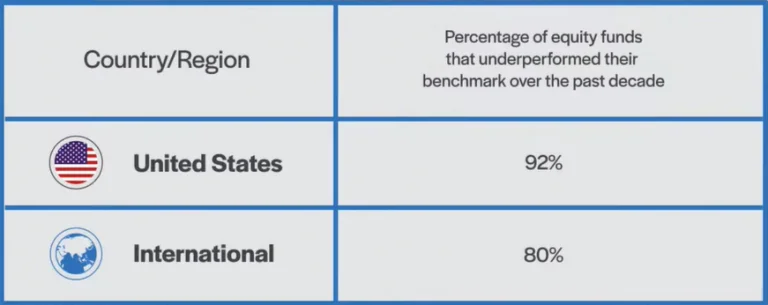
Even after including the average costs for the passively managed alternatives, Morningstar’s Active/Passive Barometer still paints a similar picture to the SPIVA Scorecard and Vanguard’s research: Most actively managed funds failed to beat their benchmarks. Only 23% of all active funds were able to exceed the returns of their average passive rivals over the 10-year period ending December 31, 2020. Specifically, 92% of U.S. large-cap funds and 80% of international large-cap funds underperformed their passive counterparts over this period.
So, there you have it. Just as academic theory suggested some 30 years ago, the overwhelming majority of actively managed funds have been underperforming passively managed indexes and funds for years. The reason why has not changed, so we don’t expect the outcomes to change either. For most investors, the best approach remains the same: Embrace a low-cost passive strategy, and ignore the allure of more expensive actively managed strategies. Their promises are premised on hope rather than reason.
Still, you may hesitate. Sure, on average, actively managed funds underperform. But there are always some that succeed. Why not invest in them? In our next video, we’ll examine just how difficult it is to pick those winning actively managed funds in advance. See you then!