In our previous blog posts, we tackled two popular ways to calculate your rate of return: the time-weighted and money-weighted methods.
As if it’s not enough to have two ways to measure your returns, there’s actually one more to talk about. It’s called the Modified Dietz Method. It’s been around since the 1960s, when mathematician Peter Dietz discovered a less computer-intensive way to approximate the money-weighted rate of return. As it’s turned out, it’s no longer as useful for that purpose since modern-day computers can easily handle the math for us. But another version of the Modified Dietz method did become a relatively common way to approximate your true time-weighted rate of return.
In this blog post, we’ll show you how the Modified Dietz method pulls off these double-duty performance calculations – sometimes approximating a money-weighted return, while other times mimicking a time-weighted return.
Before we dive into the Modified Dietz method for calculating rates of return, let’s revisit the essentials from our last two rate of return blogs. Remember, a fund’s time-weighted rate of return (TWRR) eliminates the “noise” or effect of cash flowing in or out of the portfolio. This makes it a Holy Grail for portfolio performance benchmarking. Apples to apples, how did one fund or portfolio perform compared to another (or to its benchmark) across the same period?
In contrast, the money-weighted rate of return (MWRR) factors in your individual cash flow decisions. In other words, it shows you how the individual timing of your contributions and withdrawals impacted your returns.
For better or worse, you probably see your money-weighted rate of return more often. First, it’s what you see in your account statements, as dictated by the Canadian Securities Administrators (CSA). Plus, even if you wanted to calculate the time-weighted rate of return for your DIY portfolio, you’d have a hard time finding the data to do it.
So now, let’s get back to the main attraction: the Modified Dietz method. We’re going to show you how you can use a couple of variations on it to approximate either your money-weighted or your time-weighted rate of return … but with two broad caveats to bear in mind:
First, the Modified Dietz method is (in most cases) a decent approximation for your money-weighted rate of return. It eliminates the more elaborate trial-and-error process required for calculating an exact money-weighted rate of return. This was a big benefit back when Peter Dietz created the formula back in the 1960s, but today’s computers have rendered it obsolete for these purposes.
However, something called the “linked” Modified Dietz method is usually (although not always) a good choice for approximating a true time-weighted rate of return. Since DIY investors are hard-pressed to calculate a true time-weighted rate of return, this can offer you a “better than nothing” method for calculating your portfolio’s rate of return and comparing it to an index benchmark.
With that said, let’s look at the Modified Dietz method in action. We’ll begin with how to use it to estimate your money-weighted rate of return.
Just as when you’re calculating your true money-weighted rate of return, you’ll need the following data to determine your Modified Dietz return:
First, you’ll need the value of your portfolio at the start and end of the measurement period. Unlike with a time-weighted rate of return, you do not need to know the portfolio value on the date of each cash flow.
And second, you’ll need to know the amount and date of each cash flow.
The Modified Dietz method has many of the same strengths and weaknesses as the money-weighted rate of return. Specifically, it can differ substantially from the time-weighted rate of return when large cash flows occur during periods of highly volatile portfolio values. This makes it less ideal for benchmarking most actively managed investment strategies.
The actual formula can look intimidating, so first let’s continue with the examples from our past videos, with our three fictional investors, and their investment adventures back in 2020.
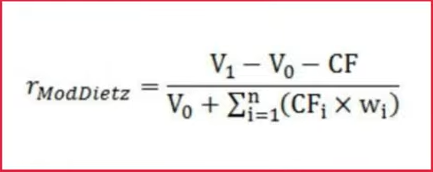
First, there was Michael. He let his portfolio ride throughout 2020, neither adding nor removing any cash.
Then, there was Gob, who added $10,000 to his portfolio on March 23rd, 2020. You may recall, Gob was very brave to jump in then. We now know in hindsight, that was the day global stock markets hit rock bottom for the year.
Last, there was Buster, who withdrew $10,000 from his portfolio on March 23rd.
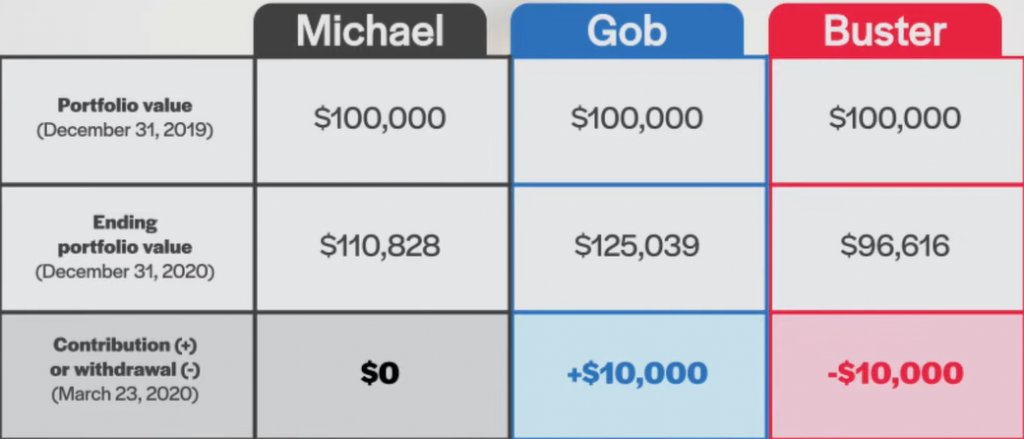
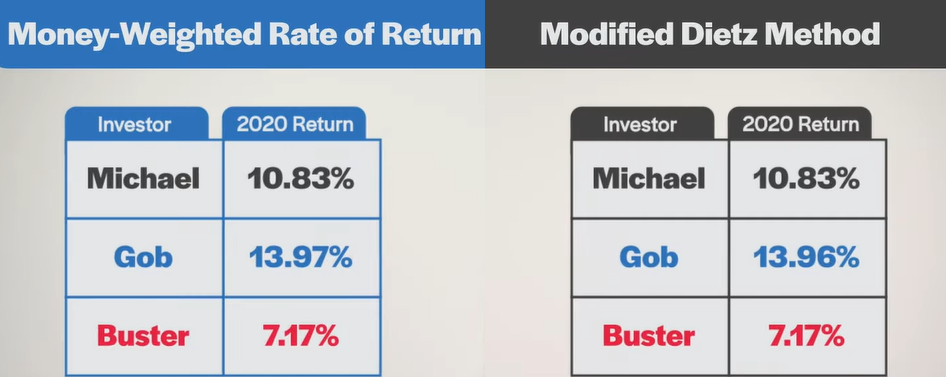
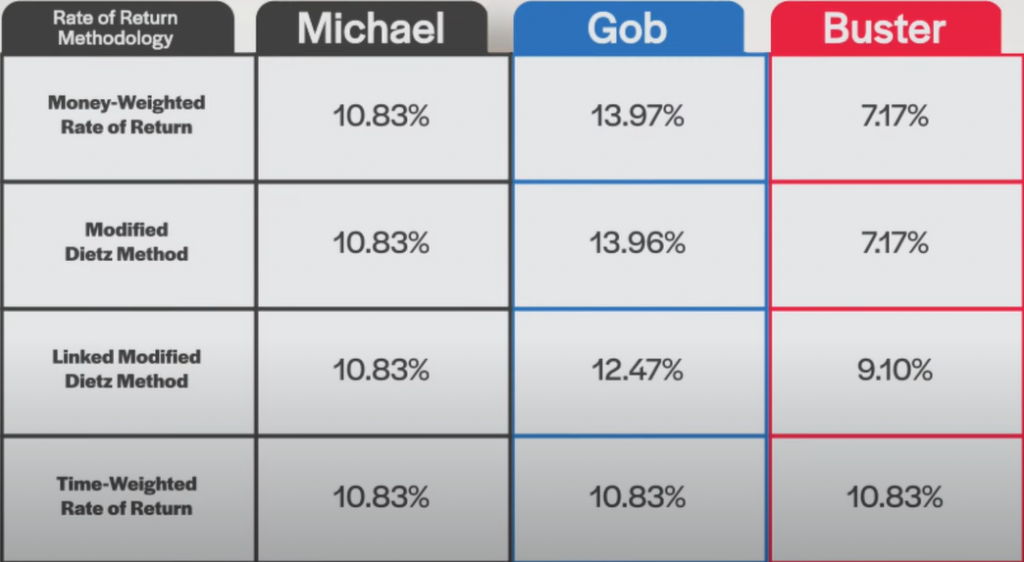
We’ll start by calculating the Modified Dietz return for Michael. As Michael made no contributions to or withdrawals from the portfolio, his Modified Dietz return will be identical to both its time-weighted and money-weighted returns. You can calculate it by simply subtracting the beginning portfolio value of $100,000 from the ending portfolio value of $110,828 and dividing the result by the beginning portfolio value of $100,000. This provides us with a Modified Dietz return of 10.83%, which is the same as Michael’s money-weighted return from our earlier blog.
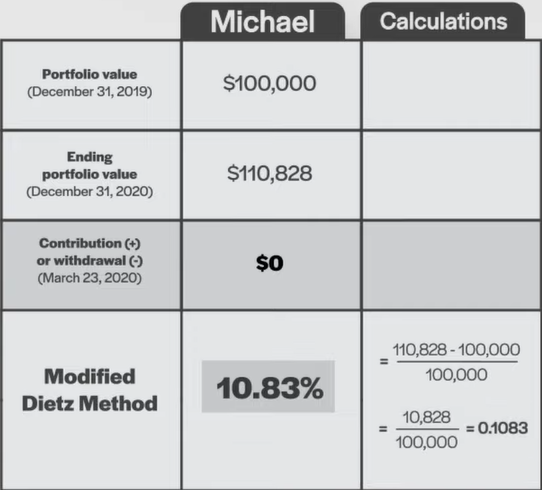
Now let’s calculate Gob’s Modified Dietz return. As mentioned, Gob added $10,000 to his portfolio on March 23rd, so we’ll need to account for this cash flow.
We’ll do this by calculating returns for when the $10,000 cash flow was present in the portfolio. The addition occurred on March 23rd, which is the 83rd day of a 366-day measurement period. By subtracting 83 from 366, and dividing by 366, we have a cash flow “weight” of 0.7732.
Another way to wrap your head around this is to recognize that the additional $10,000 was part of the portfolio for about 77% of the year—thus its weight of around 0.77. If there were multiple cash flows during the measurement period, you would do the same for each.
Next, we’ll use this value to complete the Modified Dietz formula. For the numerator, we take Gob’s $125,039 ending portfolio value, subtract his $100,000 beginning portfolio value, and subtract his $10,000 contribution. This provides us with a numerator of $15,039.
If there was more than one cash flow during the measurement period, you would instead subtract the net cash flow amount.
For the denominator, we take each cash flow, multiply it by the percentage of the measurement period it was in or absent from the portfolio, add these results together, and then add the grand total to the beginning portfolio value. Confusing, I know. But luckily, there is only one cash flow in our illustration. So, we only need to multiply Gob’s $10,000 contribution by its 0.7732 weight, and then add it to the beginning portfolio value of $100,000 to arrive at our denominator of $107,732.
We’re almost there. Now we simply divide the numerator by the denominator to arrive at Gob’s Modified Dietz return of 13.96%. Give yourself extra credit if you realize this is nearly identical to Gob’s 13.97% money-weighted return from our past blog.
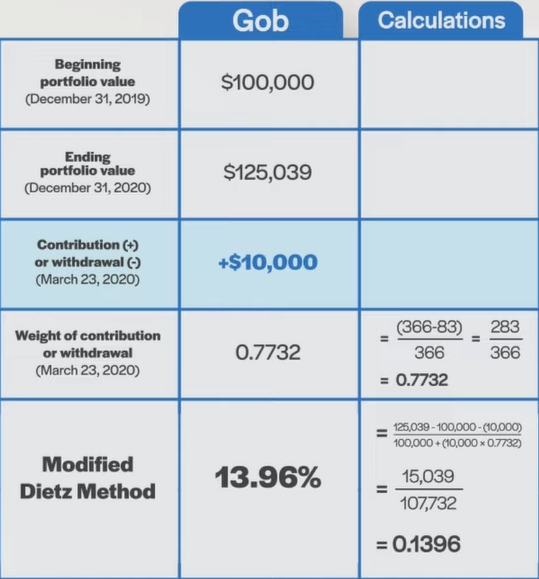
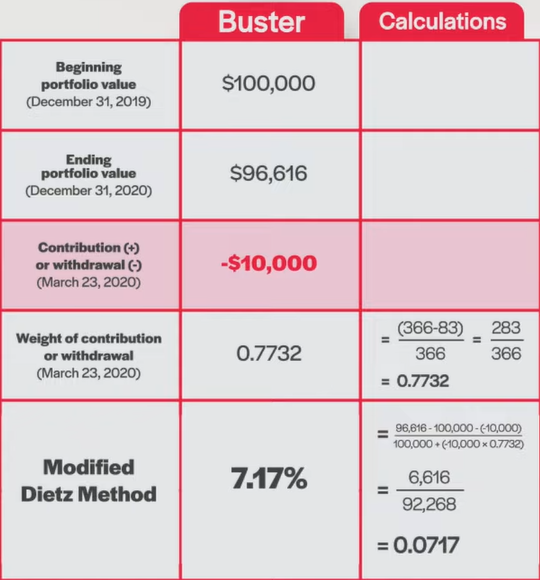
Next, we can use the same Modified Dietz formula to estimate the money-weighted rate of return for Buster. In his case, the $10,000 cash flow on March 23rd is assigned a negative value, because it was a withdrawal rather than a contribution.
To determine the numerator, we’ll take his $96,616 ending portfolio value, subtract the $100,000 beginning portfolio value, and then subtract the negative $10,000 contribution (which changes the sign to a positive value). This provides us with a numerator of $6,616.
For the denominator, we’ll take Buster’s negative $10,000 portfolio withdrawal, multiply it by the proportion of the measurement period it was absent from the portfolio (which is, again, 0.7732), and then add this negative figure to the beginning portfolio value of $100,000. The resulting denominator is $92,268.
After that, we once again divide the numerator by the denominator, to arrive at Buster’s Modified Dietz return of 7.17%. This time, this is identical to Buster’s money-weighted return of 7.17% from our past blog.
So what’s the grand take-away? In all three of our examples, the Modified Dietz return was identical, or nearly identical to the exact money-weighted rate of return. Although this is not always the case, the Modified Dietz method will generally provide a close estimate to the money-weighted rate of return in most situations.
Now we’ll take things a step further and describe how a variation on the Modified Dietz method can also be used to approximate a time-weighted rate of return.
As we touched on earlier, it’s not that hard to find your portfolio’s money-weighted rate of return these days. So using the Modified Dietz method to approximate that return may not be such a useful exercise to begin with. However, calculating your time-weighted rate of return is another kettle of fish. For this, you need to know your portfolio’s daily values, and most DIY investors simply don’t have access to these numbers.
Instead, with your monthly account statements, you can calculate a Modified Dietz rate of return over monthly periods. Then you can geometrically link these monthly results to produce an approximate time-weighted rate of return. We’ll refer to this as the linked Modified Dietz method.
Monthly value calculations and geometric linking sounds daunting, right? But not to worry. We’ve created a user-friendly calculator that uses the linked Modified Dietz method. It’s available for free on the Canadian Portfolio Manager blog.
Before we proceed, be forewarned: This work-around often yields relatively reliable results, but sometimes, the approximation is very approximate. Let’s now walk through some illustrations to show you what we mean.
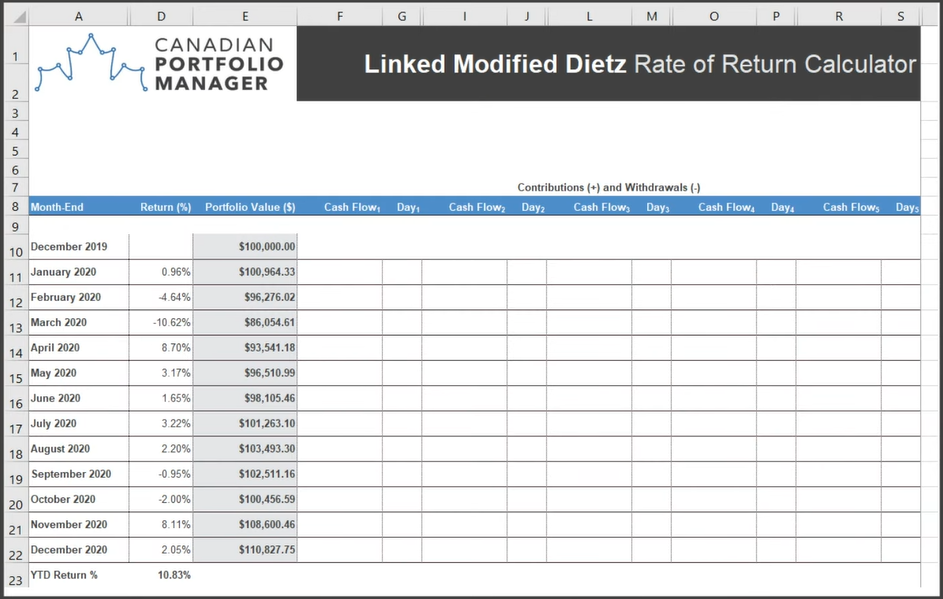
We’ll start by calculating Michael’s linked Modified Dietz return, using our handy calculator. As Michael did not contribute to or withdraw from his portfolio during the year, we’ll simply fill in Column E with his month-end portfolio values from each of his monthly account statements. After doing so, we find that Michael’s linked Modified Dietz return is 10.83%. Once again, this is identical to his time-weighted, money-weighted, and Modified Dietz rates of return. Again, this is not surprising, as all four return measurements should be the same when there have been no contributions to or withdrawals from the portfolio.
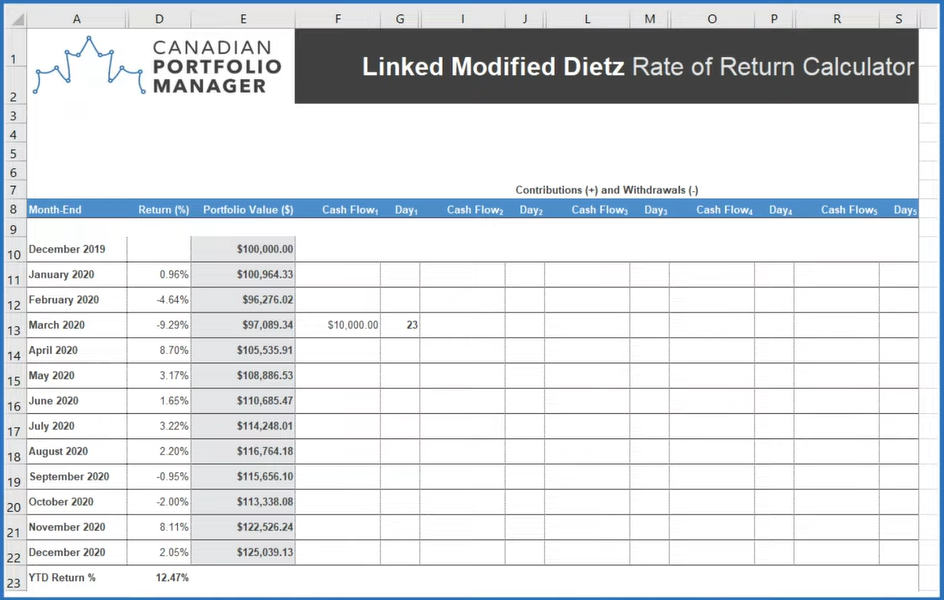
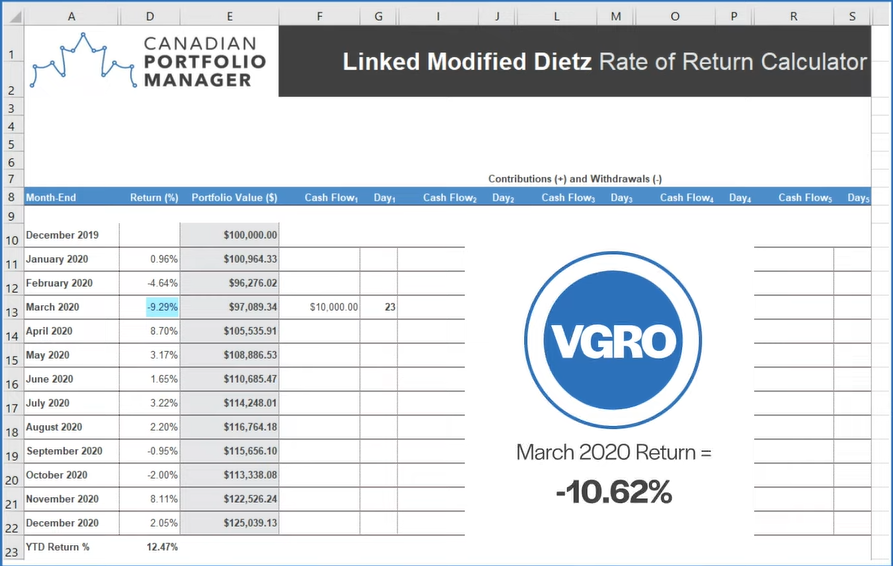
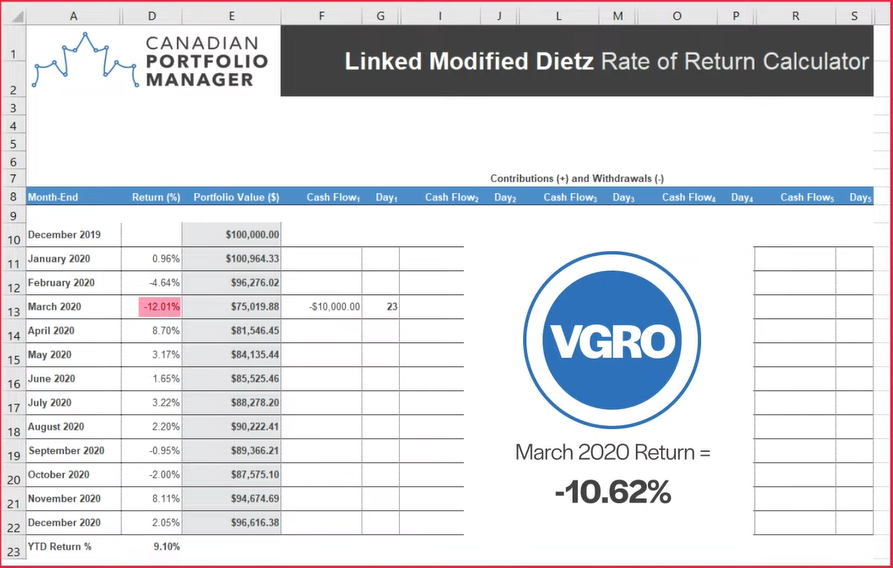
Now let’s calculate Gob’s linked Modified Dietz return. Here, we’ve also inputted the month-end portfolio values found on Gob’s account statements in column E of the spreadsheet. In the columns to the right of E, we can enter any contributions (as positive values) and withdrawals (as negative values) as well as the day of the month each occurred. Since Gob contributed $10,000 on March 23rd, we’ll enter positive $10,000 in the March 2020 row of column F. And using the drop-down menu to the right of this, we’ll select “23” as the day of the month when the contribution occurred.
After we’ve done all that, we find Gob’s linked Modified Dietz return is 12.47%, or about halfway between his money-weighted return of 13.97% and his time-weighted return of 10.83%.
We’ll follow the same process for Buster. After entering his month-end portfolio values into the spreadsheet, we’ll include his negative $10,000 withdrawal on March 23rd to arrive at a linked Modified Dietz return of 9.10%. Once again, his results fall about halfway between his money-weighted return of 7.17% and his time-weighted return of 10.83%.
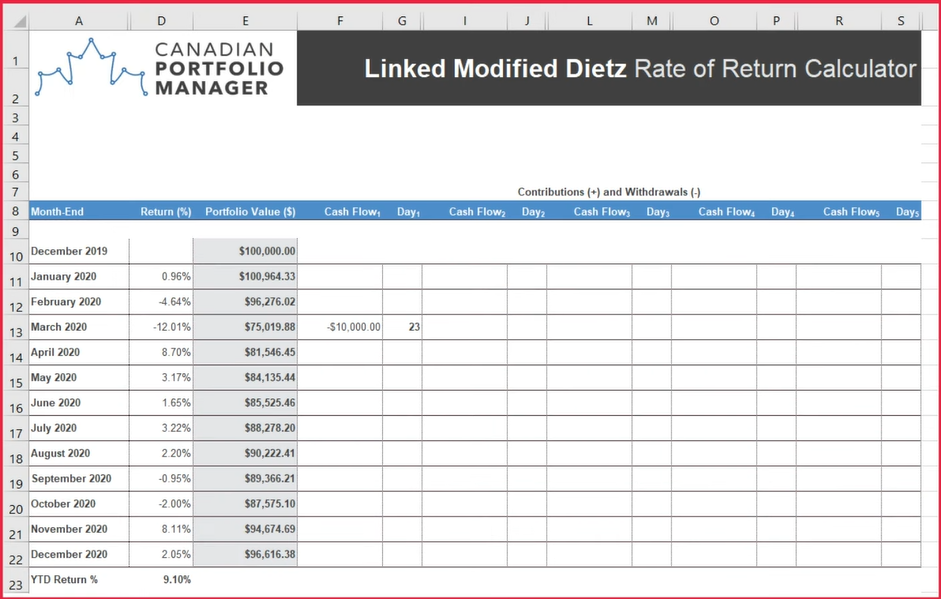
Both Gob’s and Buster’s linked Modified Dietz return came closer to their true 10.83% time-weighted rate of return than did either of their money-weighted rates of return. But both were still a far cry from being a perfect approximation.
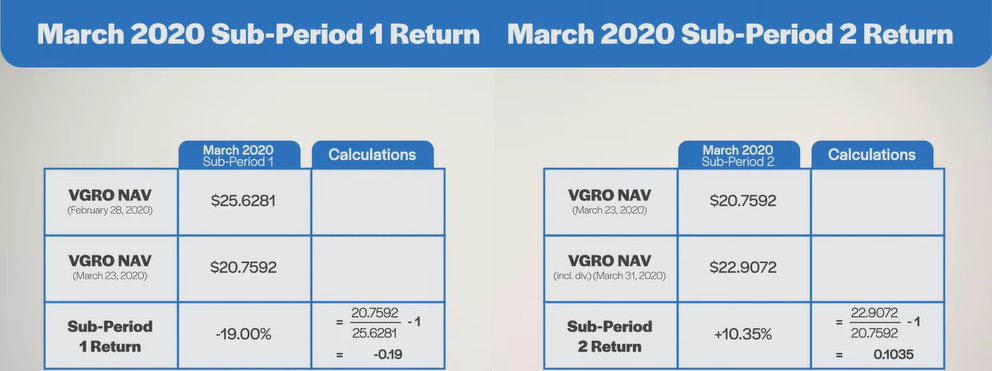
To understand why, we must first calculate the “sub-period” returns during the month the cash flows occurred.
All three of our investors were invested in the Vanguard Growth ETF Portfolio (VGRO) during the entire year, including when the fund experienced a very wild ride in March 2020 (when VGRO’s time-weighted return for the entire month of March was negative 10.62%). Moreover, the only cash flows occurred on March 23rd, which happened to be the most extreme turning point in the month.
But what if we divide the month of March into two sub-periods—before and after March 23rd? From March 1st through March 23rd, VGRO returned negative 19%. It then returned positive 10.35% for the rest of the month.
Now let’s look at what these extreme highs and lows did to our calculations. Because Gob made his contribution immediately before the good sub-period, he had a relatively better Modified Dietz return in March: negative 9.29% compared to the time-weighted return of negative 10.62%. He also had a higher Linked Modified Dietz return of 12.47% during the calendar year, compared to the true time-weighted return of 10.83%.
Buster’s withdrawal just before the good sub-period had the opposite effect. His poor timing created a relatively worse March Modified Dietz return: negative 12.01%, compared to the time-weighted return of negative 10.62%. He also had a lower linked Modified Dietz return of 9.10% during the calendar year, compared to the true time-weighted return of 10.83%.
To summarize, using the linked Modified Dietz method to approximate your time-weighted rate of return can fail under the relatively extreme conditions we established in our illustrations. In particular, it can differ substantially from a true time-weighted rate of return when large cash flows occur during highly volatile markets. If we define a sub-period as a portion of a month’s returns, then the following rules of thumb apply:
But again, remember, it’s not very often we see the kind of extremes we did in March 2020. It’s probably even more rare you’ll be as incredibly fortunate as Gob, or as massively unlucky as Buster on the precise timing of your good and bad trades.
So, despite its shortcomings, the linked Modified Dietz method can still be better than not calculating your return at all. In fact, it will usually come closer to your true time-weighted rate of return than we’ve illustrated here. Just bear in mind that market extremes might trick you into thinking you’ve done a lot better or worse than you actually did if you use this method to compare your portfolio’s rate of return to an index benchmark.
Hopefully you now have a better understanding of how to calculate your Modified Dietz return, and how to put the results into appropriate context. If you’d like to learn more about calculating your time-weighted or money-weighted rates of return, feel free to check out Part 1 and Part 2 of our rate of return blog series.