We’re coming in for a landing in our three-part, blog post series on asset location.
In Part 1, we introduced several key concepts to better understand asset location. In Part 2, we showed you how you could use a Ludicrous asset location strategy to increase your investment portfolio’s expected after-tax return … with a twist. By locating stocks in your TFSA first, non-registered account second, and RRSP last, you can essentially trick yourself into increasing your portfolio’s after-tax stock exposure. This means the expected outperformance is simply the result of taking more after-tax equity risk. Not only is it no risk-free lunch, it’s really due more to asset allocation than to asset location.
There is still an asset location strategy that is truly more tax-efficient than any we’ve discussed so far. In this asset location series finale, we’ll show you how to implement the Holy Grail of asset location: The Plaid Strategy.
In Spaceballs, it didn’t get any crazier than “plaid speed” for our intrepid space travelers. The same might be said for a Plaid asset location strategy. And yet, it’s still based on several key concepts from Part 1. Most importantly, the after-tax results in your RRSP behave much like the results in your TFSA. Just like in your TFSA, you never pay tax on any growth earned on the after-tax portion of your RRSP. Also, your after-tax asset allocation drives your after-tax returns, not your before-tax asset mix.
If you don’t believe me, please revisit Part 1 for the full explanation on these mind-bending notions. Once you grasp them, the lightbulb comes on, and you realize the government portion of your RRSP, and all growth on this portion, never really accrues to you.
Brace yourself, because you can now go plaid with your asset location strategy, as follows:
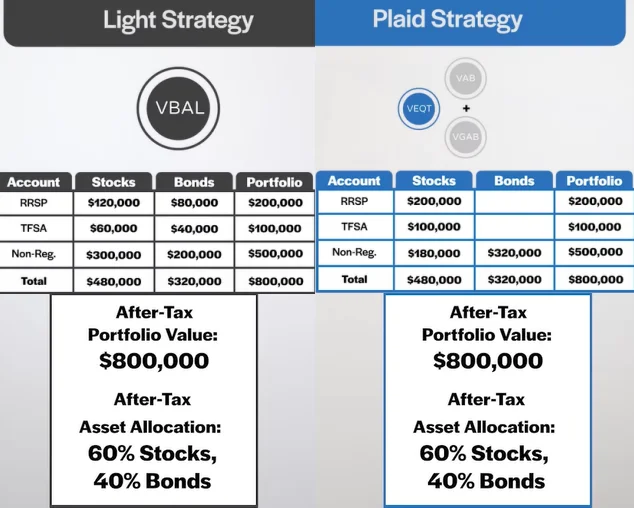
You begin by determining your after-tax total portfolio value. For this example, we’ll use the same before-tax account values from our last post: a $400,000 RRSP, a $100,000 TFSA and a $500,000 non-registered account. We’ll also assume the same 50% average tax rate on the RRSP withdrawals in retirement. Based on this, our RRSP is worth $200,000 after-tax (or 50% of the $400,000 before-tax RRSP value), making the total after-tax portfolio value $800,000.
Like our last post, we’ll use a Light portfolio as our benchmark, with an after-tax asset allocation target of 60% stocks and 40% bonds. And once again, we’ll use the single-fund Vanguard Balanced ETF Portfolio (or VBAL) across all accounts.
We’ll target the same asset mix for our Plaid portfolio, using the same funds we used for our Ludicrous portfolio. So, for our stock allocation, we’ll hold the Vanguard All-Equity ETF Portfolio (VEQT). For bonds, we’ll hold the Vanguard Canadian Aggregate Bond Index ETF (VAB) and the Vanguard Global Aggregate Bond Index ETF (CAD-hedged) (VGAB).
In both our Light and Plaid examples, we’ll allocate $480,000 of the after-tax portfolio value to stocks, and $320,000 to bonds, for a total of $800,000.
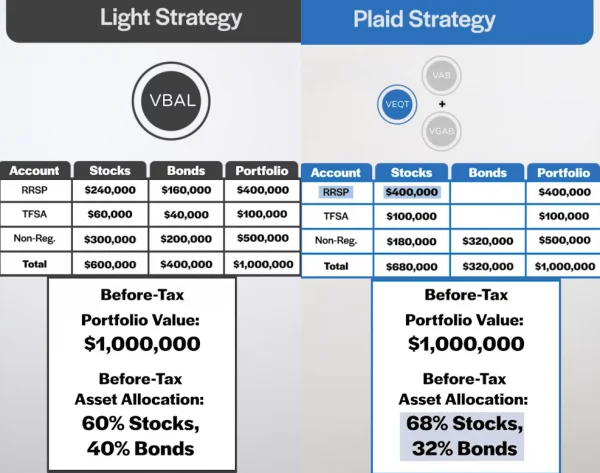
In our Plaid portfolio, we’ll locate $200,000 of stocks to the RRSP first and $100,000 to our TFSA next, for a total of $300,000 in stocks. (Practically speaking, the RRSP is actually worth $400,000 before-tax, so this is the amount of VEQT we’ll purchase in the RRSP.) We still need another $180,000 in stocks, so we’ll purchase this amount in our non-registered account.
Next, we’ll purchase the entire $320,000 bond allocation in our non-registered account. We’ve now created a 60% stock, 40% bond after-tax asset allocation for both our Light and Plaid strategies.

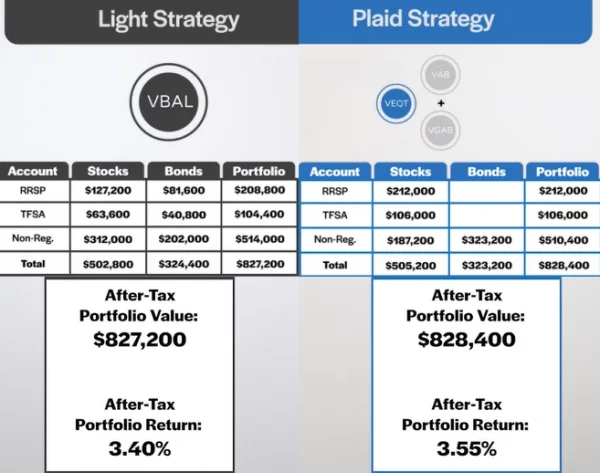
Let’s now assume stocks return 6% over the next year, and this return is comprised of a fully taxable 2% dividend yield, plus a 4% capital gain with a 50% inclusion rate. We’ll also assume our bonds return a fully taxable 2% over the next year. Our average tax rate is 50%, and since the $200,000 RRSP value is an after-tax figure (and again, the after-tax RRSP behaves like a TFSA for tax purposes), there will be no taxes payable on this amount, or on any of its investment growth.
After paying all taxes owing at the end of the year, we find Plaid outperformed Light by 0.15% after-tax. By allocating the stocks with higher expected growth to the RRSP and TFSA first (while keeping the after-tax asset allocation the same), the Plaid portfolio was able to outperform the Light portfolio with a truly more tax-efficient approach.

So, aside from the fact that this level of asset location is ridiculously complicated, why isn’t everyone managing their ETF portfolio this way?
Even though both strategies had the same after-tax asset allocation, the Plaid asset location strategy required a higher before-tax allocation to stocks. If we look at the portfolio from a before-tax perspective, you’d need to fill your entire before-tax RRSP with $400,000 of stocks, resulting in a before-tax asset allocation of 68% stocks and 32% bonds. Even if you end up a year later with a 60/40 after-tax mix, it doesn’t take a financial whiz to notice you’re starting out with a riskier, before-tax allocation.
Realistically, this is a tough pill to swallow. Most investors are used to thinking about their accounts on a before-tax basis, especially since that’s how the numbers get reported to you. To manage a Plaid strategy requires a mind-bending leap into another dimension: You’ll need to look past those seemingly riskier, before-tax numbers in your RRSP statements, and accept that the government is taking on that extra equity risk for you.

As with our other portfolios, let’s review the advantages and disadvantages of a Plaid asset location strategy:
We’ve now reached the end of our asset location blog post series. Our Plaid asset location strategy overshoots the complexity of other strategies by about a million miles, so no one will blame you—and I may even applaud you—if you decide to stick with a Light asset location strategy. As I’ve said before, by using a single asset allocation ETF in each of your accounts, you’ll still be light years ahead of most DIY investors.
What else can I answer for you about asset location, asset allocation, and before- and after-tax portfolio management? Let me know, and we’ll keep the conversation going.