
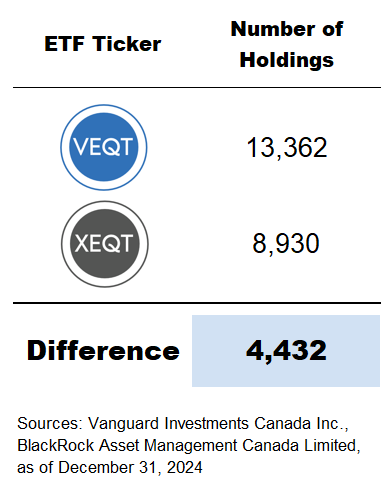
You might be thinking: “How can VEQT, with its investment in over 13,000 companies globally, be less diversified than XEQT, which holds around 9,000 stocks?”
Well, let’s hold that thought for a moment. By the end of this video, I’m sure those in the JustBuyXEQT community will find yet another reason to favour XEQT over VEQT in their portfolios.
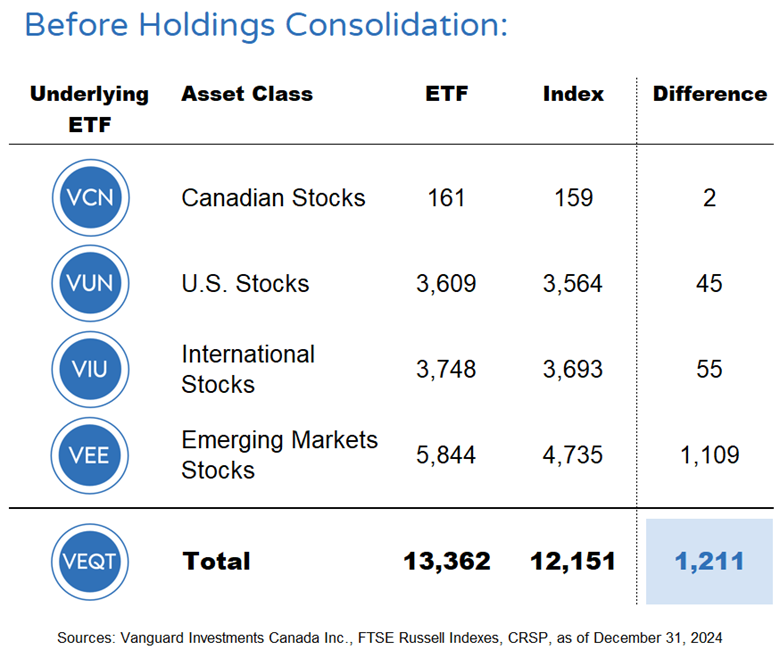
You would think the number of holdings listed on an ETF’s website would always be accurate, but that’s not always the case. Take VEQT, for example. When comparing the listed holdings to the actual indexes its underlying ETFs track, we notice something interesting. Across most asset classes, the differences are modest. But when we look at the emerging markets component, VEQT seems to hold over 1,100 more emerging market stocks than its index. Perhaps Vanguard has a rogue trader at the company buying up extra emerging markets stocks just for the thrill of it, but I suspect there’s more going on under the hood.
If we sort VEQT’s 5,844 emerging markets holdings, we see some duplication. For example, the Agricultural Bank of China appears multiple times, once for its Hong Kong H shares and again for its A shares on the Shanghai and Shenzhen exchanges. Same company – different share classes. By cleaning up these duplicates, we can get a clearer picture.
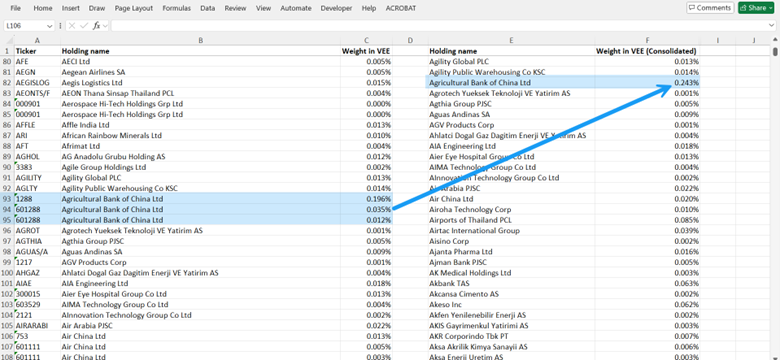
Source: Vanguard Investments Canada Inc., as of December 31, 2024
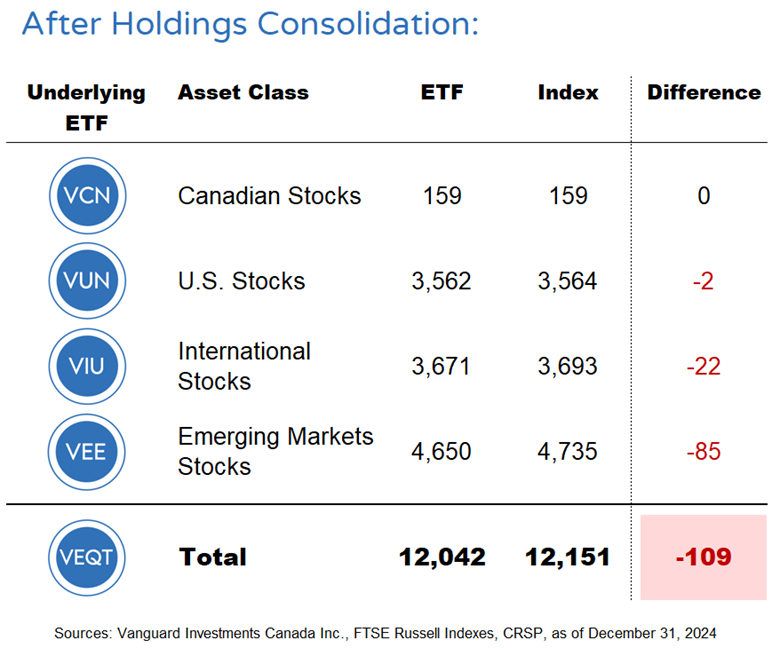
As you can see, after consolidating, VEQT’s stock count drops to 12,042, which is closer to the 12,151 total tracked by its indexes.
XEQT also suffers from some erroneous holdings. However, the impact is less significant than VEQT’s. After removing cash and derivatives, and consolidating duplicate stocks, XEQT’s holdings drop from 8,930 to 8,741.
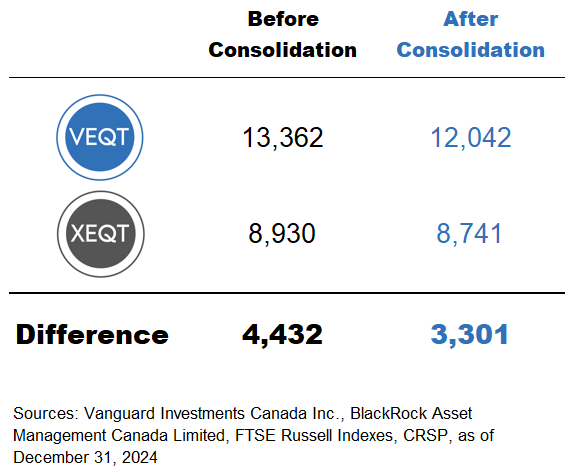
We’ve managed to close the holdings gap a bit, but VEQT still includes around 3,300 more stocks than XEQT. So, how is it that XEQT is more diversified than VEQT? While the number of companies in an ETF is an important factor, it’s only part of the overall diversification picture.
Let’s look at two hypothetical portfolios for comparison:
A useful way to adjust a portfolio’s stock count for concentration is by calculating its effective number of stocks. This metric indicates how many stocks in a portfolio are meaningfully contributing to its overall performance. It can range from 1 (for a one-stock portfolio) all the way up to the total number of stocks held in the portfolio (which would be the case for an equally weighted stock portfolio).
To calculate a portfolio’s effective number of stocks, we would sum the squared weights of each security in the portfolio and then take the reciprocal of this result. A higher number implies a more diversified portfolio, while a lower number signals less diversification.
For example:
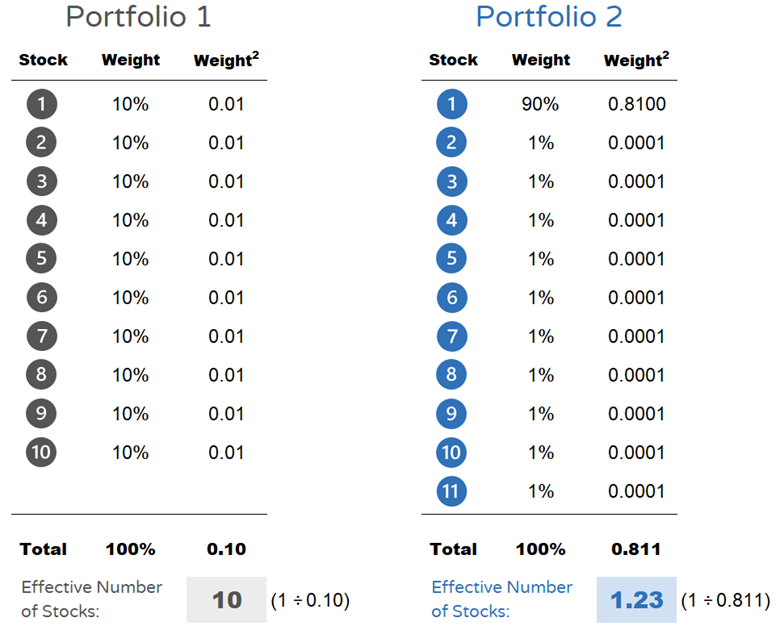
When we apply this analysis to our two ETFs, we find the following:
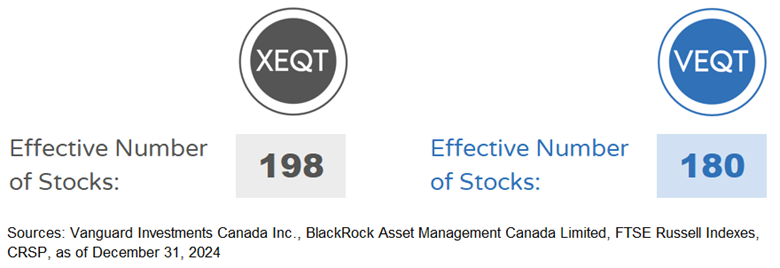
This shows that XEQT is slightly more diversified than VEQT, even though VEQT holds more individual stocks.
The reason for this lies largely in XEQT’s lower allocation to Canadian stocks (which has a lower effective number of companies) and its higher allocation to international stocks (which has a higher effective number of companies) compared to VEQT’s allocation mix.
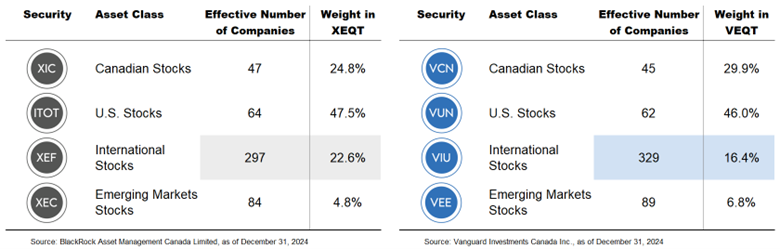
So, is XEQT more diversified than VEQT? In terms of pure stock count, VEQT may appear more diversified. But when we adjust for concentration and look at the effective number of stocks, XEQT comes out ahead. This is mainly due to XEQT’s higher allocation to international stocks, which provides more diversification.
In the end, the diversification debate isn’t just about the number of stocks held by an ETF—it’s about the concentration of the various stocks in the portfolio. If you’re deciding between XEQT and VEQT, understanding this nuanced difference could help you make a more informed decision for your portfolio.